Data Labs: SQL Analytics and a Graph Database
Two labs treat the same kind of question, where things go and how often, with two different data models: tables and graphs.
100,000
flights queried
631
average flight distance
70
bike-share stations in the graph
354,000+
trips as relationships
Problem
Understanding the challenge and user needs
Flight records and bike trips both describe movement between places. A table answers how many; a graph answers what connects to what.
Approach
Strategy and methods used to address the problem
DuckDB joined about 100,000 flights from January 2008 to a reference table of more than 82,000 airport codes and to country data with plain SQL. Neo4j loaded 70 bike-share stations and more than 354,000 trips as nodes and relationships, queried with Cypher.
(opens in a new tab)Final Solution
The final design and outcome
The same movement data supports aggregate reporting in SQL and route and connection questions in the graph.
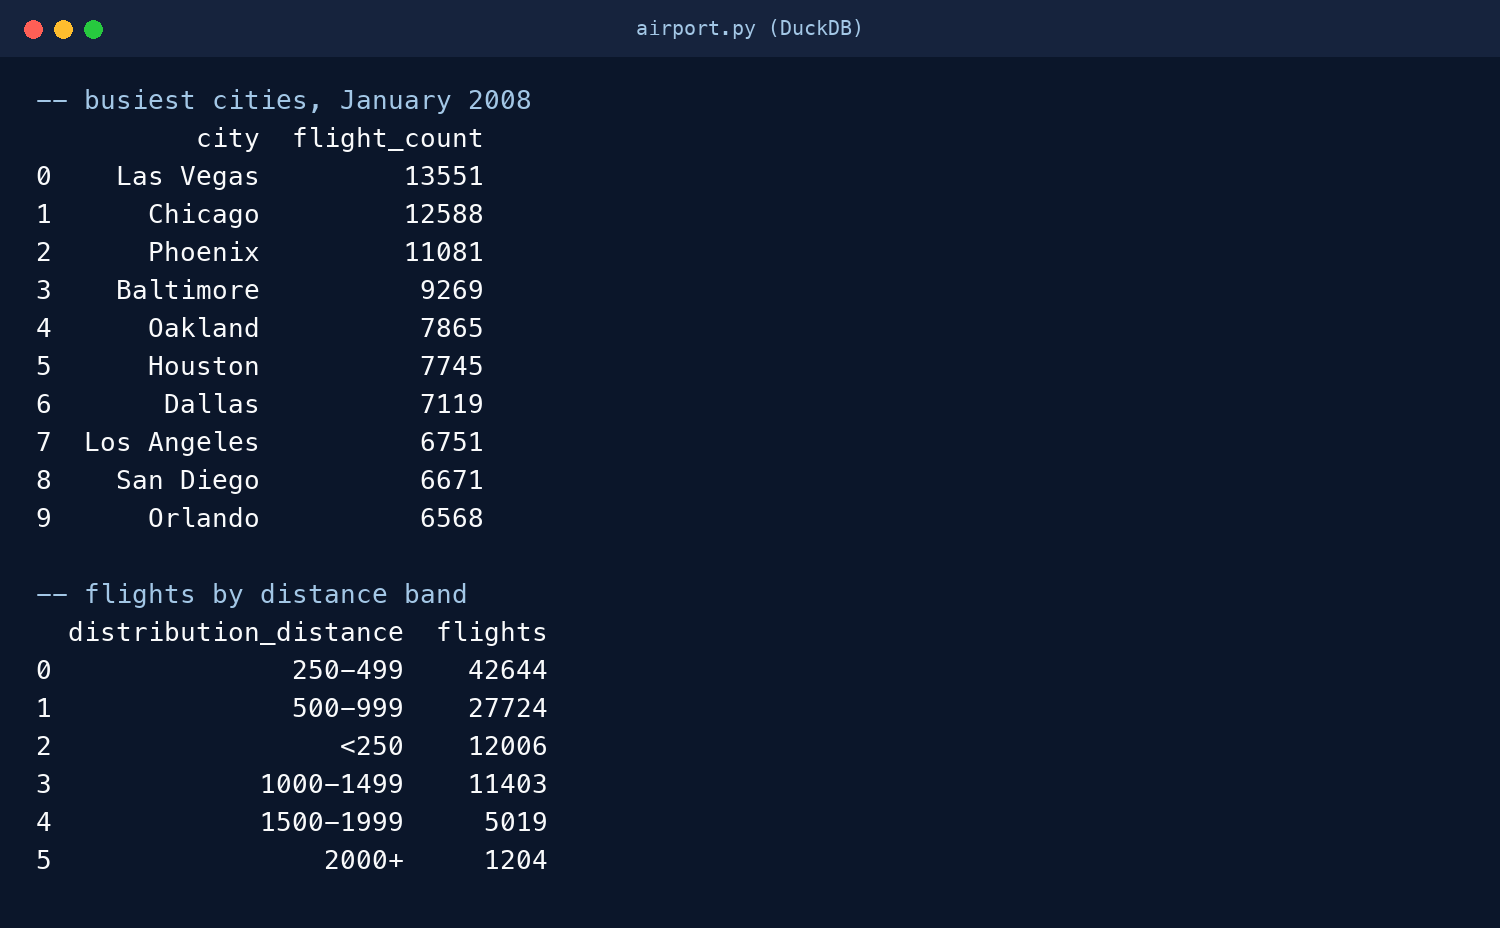
Busiest origin cities, January 2008
| City | Flights |
|---|---|
| Las Vegas | 13,551 |
| Chicago | 12,588 |
| Phoenix | 11,081 |
| Baltimore | 9,269 |
| Oakland | 7,865 |
| Houston | 7,745 |
| Dallas | 7,119 |
| Los Angeles | 6,751 |
| San Diego | 6,671 |
| Orlando | 6,568 |
Flights by distance band
| Distance | Flights |
|---|---|
| Under 250 | 12,006 |
| 250 to 499 | 42,644 |
| 500 to 999 | 27,724 |
| 1,000 to 1,499 | 11,403 |
| 1,500 to 1,999 | 5,019 |
| 2,000 and over | 1,204 |
Distances run from 66 to 2,363, in the dataset's own units.
Busiest routes
| Route | Flights | Distance |
|---|---|---|
| Houston Hobby to Dallas Love Field | 762 | 239 |
| Dallas Love Field to Houston Hobby | 752 | 239 |
| Oakland to Los Angeles | 562 | 337 |
| Los Angeles to Oakland | 554 | 337 |
| Las Vegas to Phoenix | 516 | 256 |
Impact & Validation
Results, learnings, and outcomes
Choosing the data model to fit the question, rather than the tool at hand, shapes every later design decision.