Home Credit: Predicting Loan Default
Home Credit lends to people with little or no credit history. The model predicts the probability that an applicant defaults, drawing on 58.4 million rows across seven linked tables of applications, bureau records, and payment histories.
58.4M
rows across seven tables
0.798
out-of-fold AUC
0.797
private leaderboard AUC
32
logged experiments
Problem
Understanding the challenge and user needs
Only 8 percent of the 307,511 training applicants defaulted, and the signal sits scattered across monthly balances and past loans rather than in the application itself. A model that reads one table misses most of what a lender needs to know.
The seven tables
| Table | Rows |
|---|---|
| Bureau balance | 27,299,925 |
| Installment payments | 13,605,401 |
| Point-of-sale and cash balance | 10,001,358 |
| Credit card balance | 3,840,312 |
| Bureau | 1,716,428 |
| Previous applications | 1,670,214 |
| Applications (training) | 307,511 |
Approach
Strategy and methods used to address the problem
Eight notebooks build the solution in stages: a baseline, relational aggregations, temporal features, null-importance feature selection, an imbalance study, a three-model blend, SHAP interpretability, and a final round of Optuna tuning with multi-seed bagging. One fixed five-fold split scores every experiment, and a results file logs all 32 runs, including the ones that failed.
Final Solution
The final design and outcome
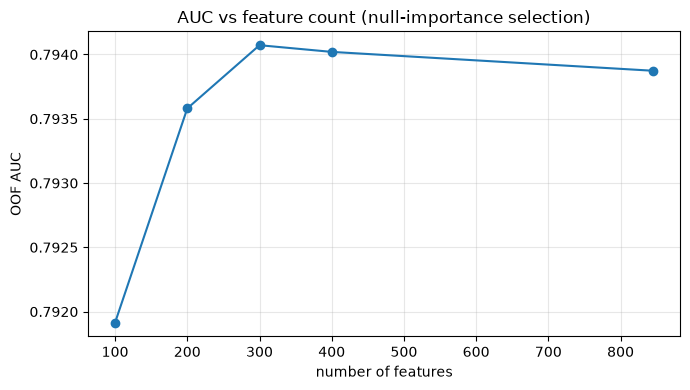
Out-of-fold AUC rose from 0.762 on raw data to 0.798 for the final blend of LightGBM, XGBoost, and CatBoost. Feature selection cut 845 engineered features to 300 without losing accuracy, and the final submission scored 0.797 on the competition's private leaderboard.
AUC by stage
| Stage | Out-of-fold AUC |
|---|---|
| Application-table baseline | 0.769 |
| Plus relational aggregations from six auxiliary tables | 0.793 |
| Plus temporal and domain features | 0.794 |
| Plus null-importance selection to 300 features | 0.794 |
| Plus LightGBM, XGBoost, and CatBoost blend | 0.796 |
| Plus state-split features, tuning, and bagging | 0.798 |
One fixed five-fold split scores every stage, so the figures compare directly.
Impact & Validation
Results, learnings, and outcomes
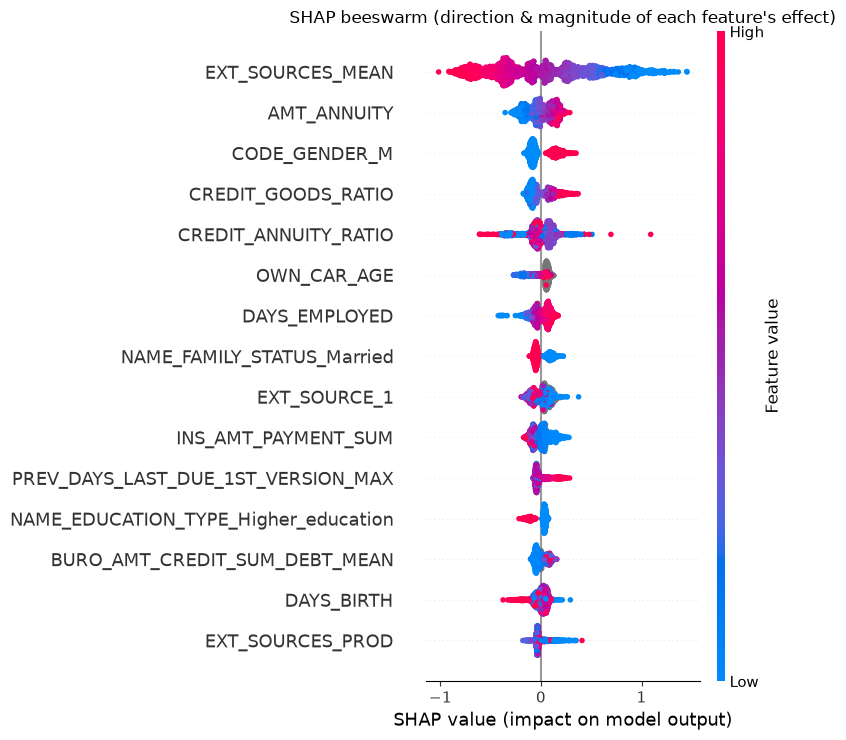
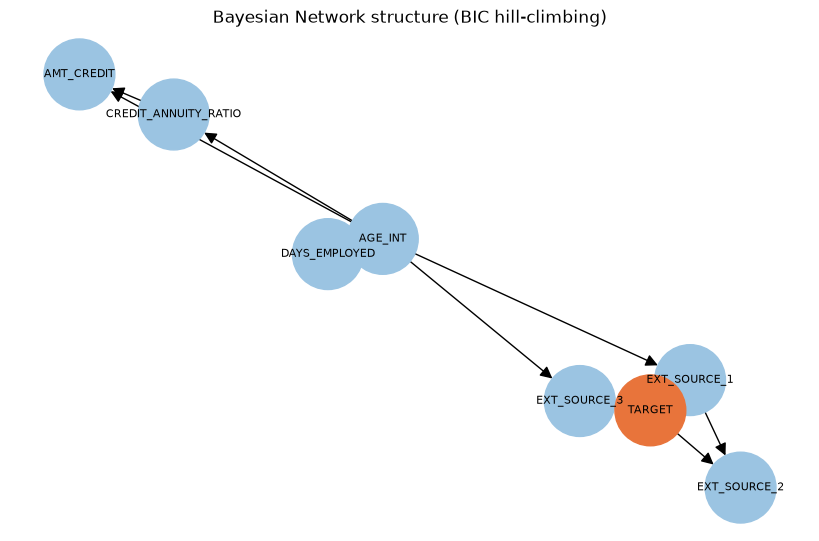
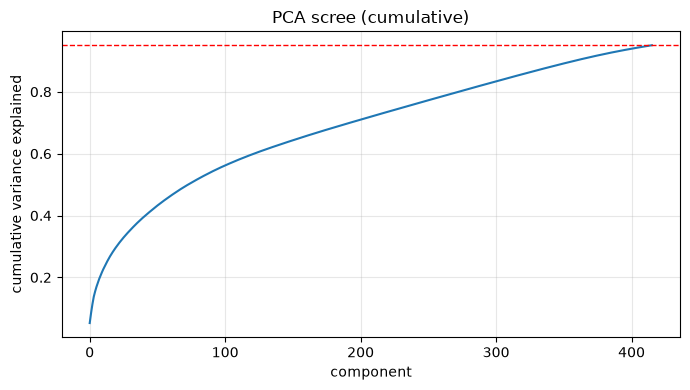
SHAP values explain each prediction in terms a credit officer can check: external credit scores, the size of the annuity against income, and payment behavior on earlier loans. The log of negative results, from PCA to a Bayesian network, documents what did not work and why.
(opens in a new tab)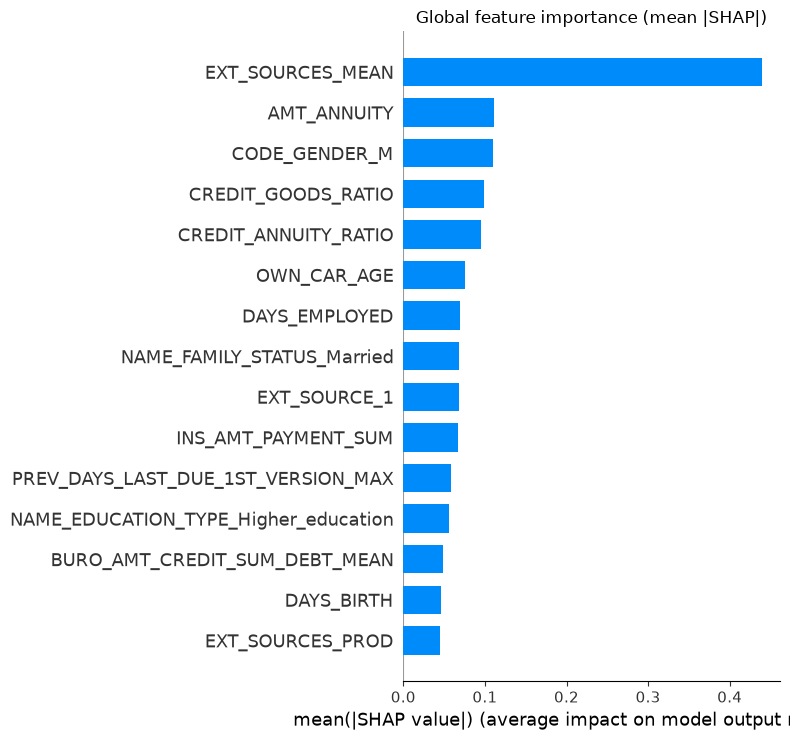
Presentation
The deck, slide by slide
Slide 1 of 18