Computational Modeling of Neural Networks
How depression alters neural responses to emotional music. An fMRI study comparing MDD and healthy control groups across three brain regions.
At a Glance
Key findings
Dataset & Conditions
24 subjects (MDD + Control) listening to emotional music and neutral tones during fMRI scanning
Analysis Workflow
SPM preprocessing, random-effects GLM, voxel-based contrasts, and VOI beta extraction
Key Finding
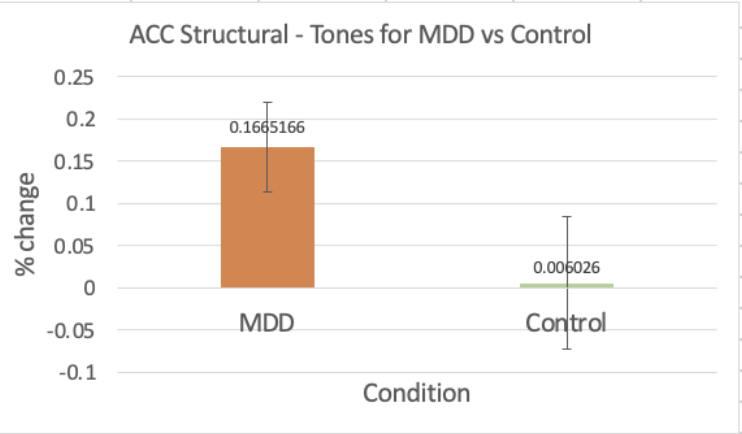
MDD group shows elevated ACC activation across all conditions — highest divergence in tones baseline
Brain Scan Gallery
Click any scan to explore in detail
Results Dashboard
Percent signal change: MDD vs Control across regions and conditions
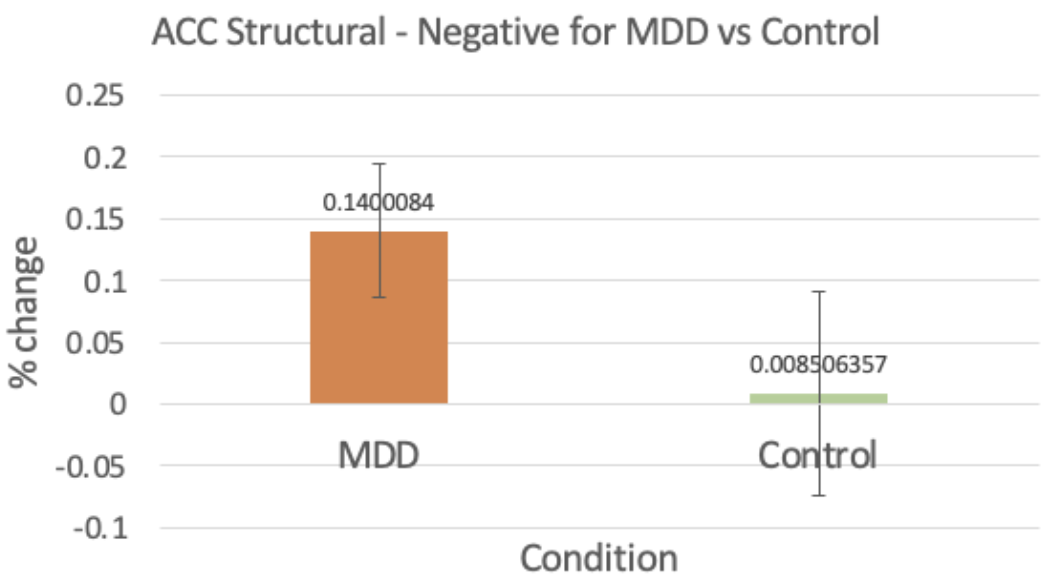
ACC - Negative Stimuli
ACC structural response to negative stimuli
MDD 13% higher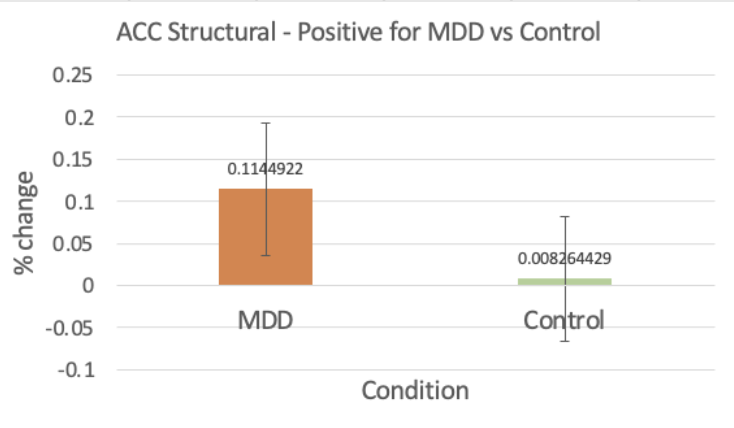
ACC - Positive Stimuli
ACC structural response to positive stimuli
MDD 11% higherACC - Tones (Control Condition)
ACC structural response to neutral tones
MDD 16% higher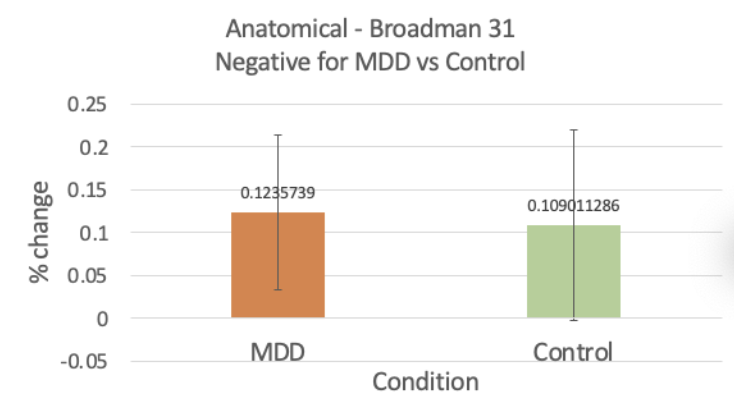
Brodmann 31 - Negative Stimuli
Brodmann area 31 response to negative stimuli
Similar response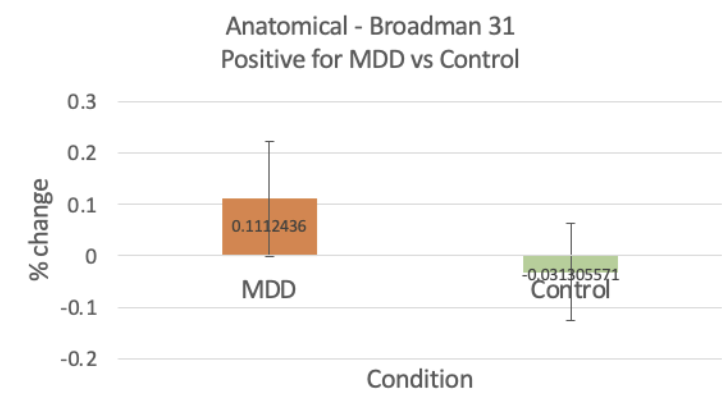
Brodmann 31 - Positive Stimuli
Brodmann area 31 response to positive stimuli
MDD 14% higher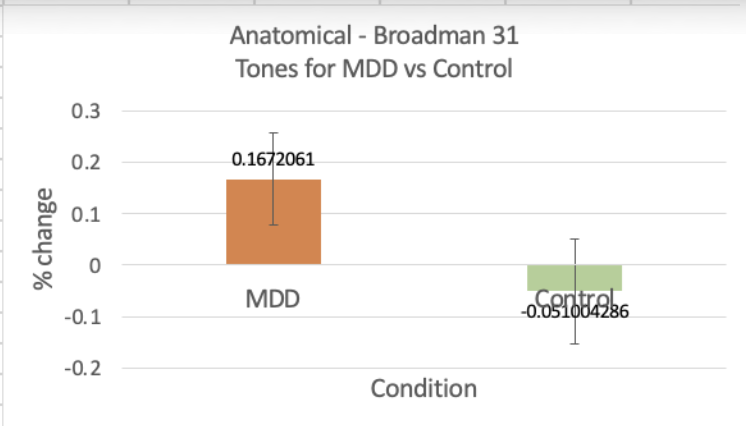
Brodmann 31 - Tones (Control Condition)
Brodmann area 31 response to neutral tones
MDD 22% higher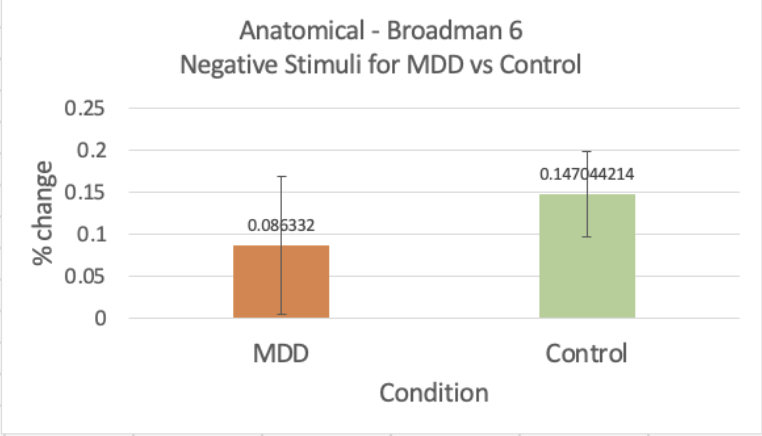
Brodmann 6 - Negative Stimuli
Brodmann area 6 response to negative stimuli
Control 6% higher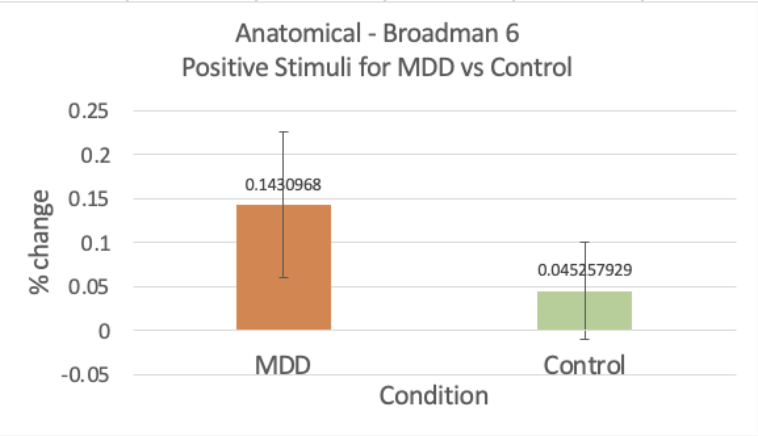
Brodmann 6 - Positive Stimuli
Brodmann area 6 response to positive stimuli
MDD 10% higherAnalysis Workflow
From raw data to insight — a six-step pipeline
Data Inputs
- fMRI BOLD data from 24 subjects
- 3 conditions: negative music, positive music, neutral tones
- Anatomical T1 scans for registration
Preprocessing
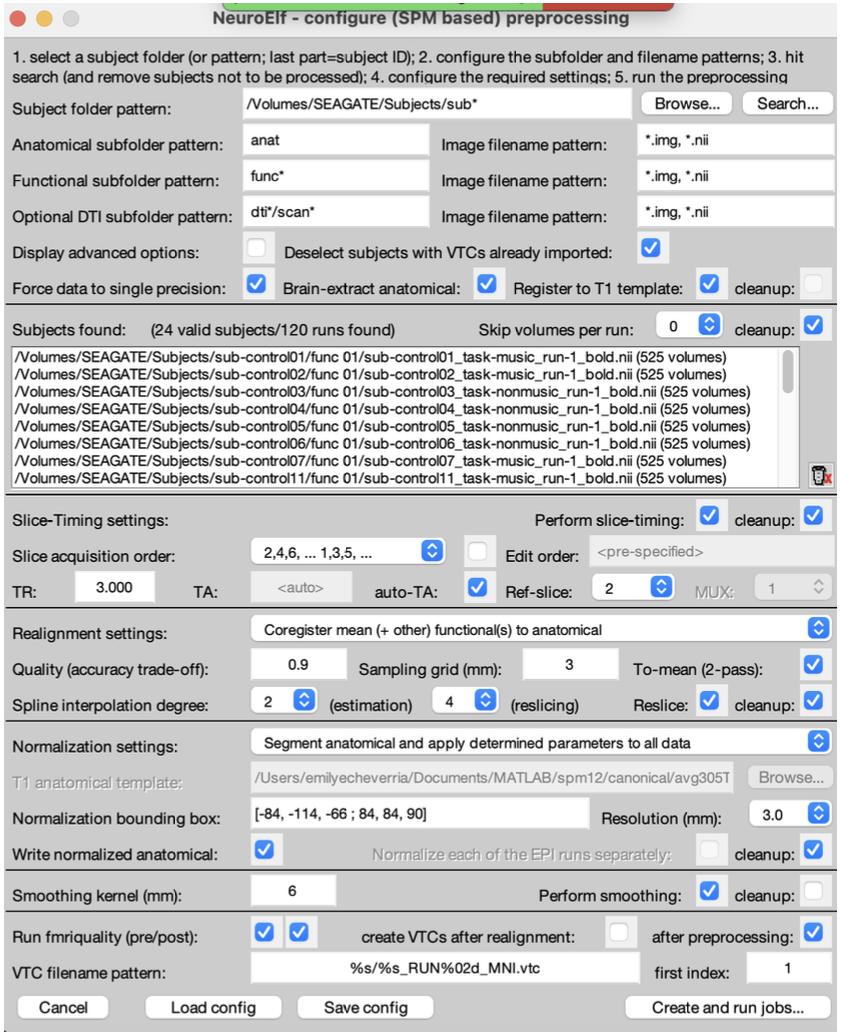
- Slice-timing correction and motion realignment
- Normalization to MNI space (3mm)
- Smoothing with 6mm Gaussian kernel
GLM Setup
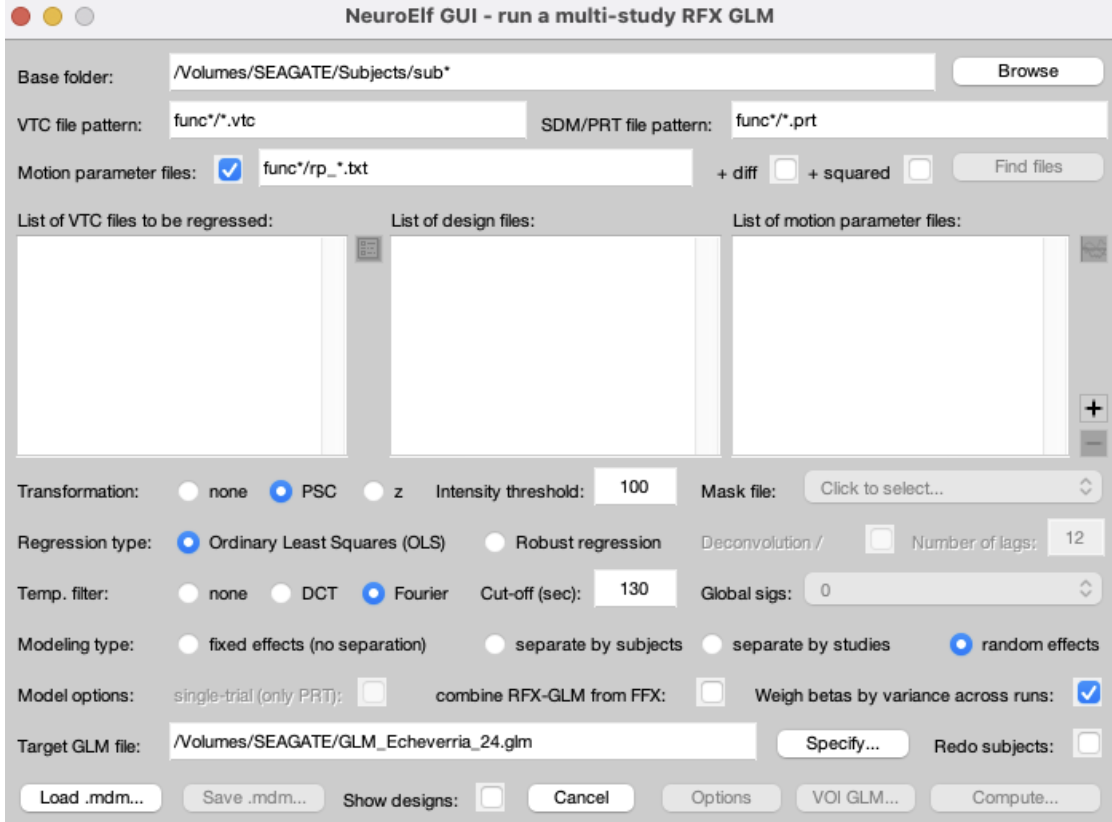
- Random effects GLM via NeuroElf
- OLS regression with Fourier temporal filter
- Beta weights by variance across runs
Contrasts
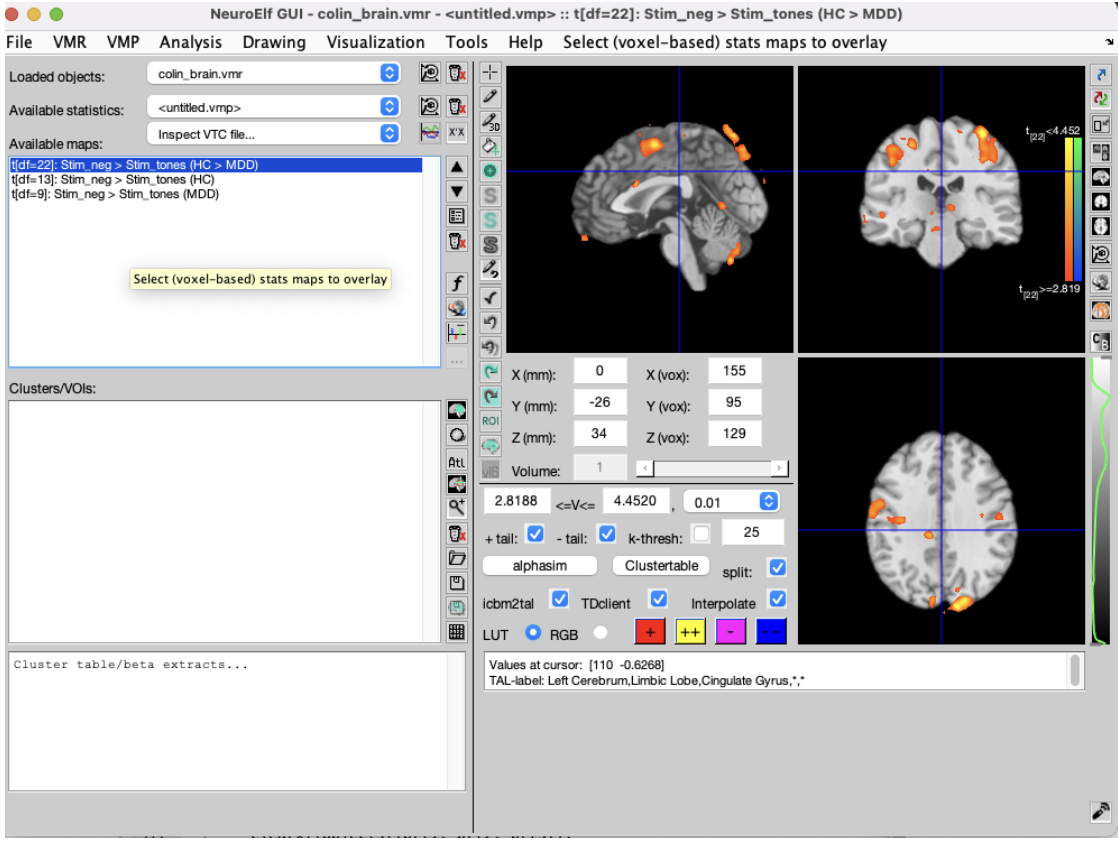
- Stim_neg > Stim_tones (HC > MDD)
- Stim_neg > Stim_pos (HC > MDD)
- Group-level t-maps at p < 0.01
Visualization
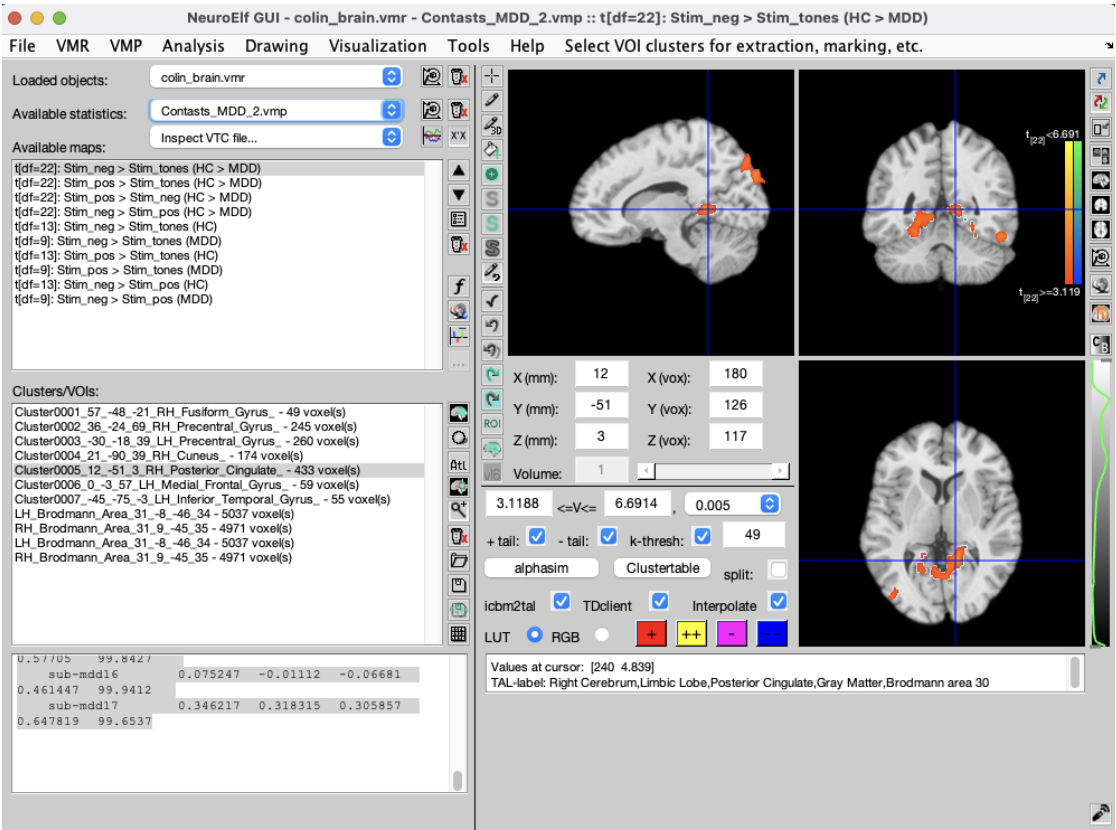
- Voxel-based statistical overlays on colin_brain.vmr
- Cluster thresholding with AlphaSim correction
- VOI extraction for ACC, BA31, BA6
Interpretation
- Beta extraction for each ROI and condition
- MDD vs Control percent signal change comparison
- Statistical significance assessment
Data Inputs
- fMRI BOLD data from 24 subjects
- 3 conditions: negative music, positive music, neutral tones
- Anatomical T1 scans for registration
Preprocessing
- Slice-timing correction and motion realignment
- Normalization to MNI space (3mm)
- Smoothing with 6mm Gaussian kernel
GLM Setup
- Random effects GLM via NeuroElf
- OLS regression with Fourier temporal filter
- Beta weights by variance across runs
Contrasts
- Stim_neg > Stim_tones (HC > MDD)
- Stim_neg > Stim_pos (HC > MDD)
- Group-level t-maps at p < 0.01
Visualization
- Voxel-based statistical overlays on colin_brain.vmr
- Cluster thresholding with AlphaSim correction
- VOI extraction for ACC, BA31, BA6
Interpretation
- Beta extraction for each ROI and condition
- MDD vs Control percent signal change comparison
- Statistical significance assessment
Conclusions & Next Steps
Key Takeaways
MDD subjects showed consistently elevated ACC activation across all stimulus conditions, suggesting heightened emotional processing even to neutral stimuli
Brodmann area 31 (posterior cingulate) exhibited the largest group differences during tones, indicating altered default-mode network activity in depression
Brodmann area 6 showed a reversed pattern — controls had higher activation for negative stimuli, suggesting intact motor-preparation responses dampened in MDD
Future Work
Longitudinal study tracking activation changes with treatment
Connectivity analysis between ACC, BA31, and amygdala
Machine learning classification of MDD vs Control from activation patterns